Bangalore
08042753298
+919686928701

Items tagged with 'sem analysis'

68179d65be22ee500d53ff54 Card 2

product image
Imaging & Characterization

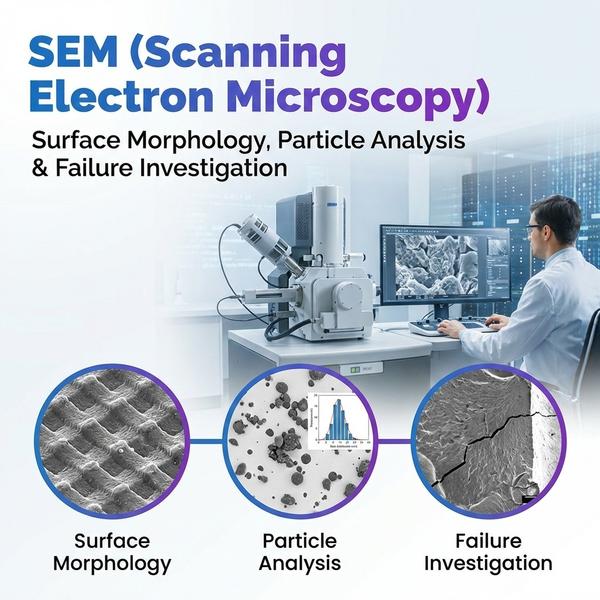
At Dextrose Technologies Pvt. Ltd., we provide SEM (Scanning Electron Microscopy) for high-resolution imaging and detailed surface characterization of materials and biological samples (as applicable). SEM helps you visualize surface morphology, topography, particles, and defects with clarity—supporting R&D, quality investigations, and failure analysis. Surface morphology and topographical analysis We capture high-magnification images to evaluate surface texture, porosity, cracks, coatings, and microstructural features. SEM is ideal for comparing batches, processing conditions, and material finishes. Particle shape and size evaluation We image particles to assess shape, agglomeration, and size distribution trends (image-based), supporting powders, pigments, fillers, nanomaterials (where applicable), and formulation studies. Failure and defect analysis We support root-cause investigations for defects such as fractures, delamination, inclusions, corrosion features, and surface contamination—providing image evidence and interpretation notes to guide corrective actions. Deliverables * High-resolution SEM images (multiple magnifications) * Observation summary highlighting key morphological features * Optional: EDX elemental mapping/spot analysis (if required) * Report-ready documentation for R&D or QC investigations Get started Share your sample type, objective (morphology/particles/failure), and preferred magnification range. We’ll recommend the best SEM imaging plan and deliverables.

68179d65be22ee500d53ff54 Card 2

product image
Material Characterization

At Dextrose Technologies Pvt. Ltd., our Technical Reporting & Failure Analysis Support ensures you don’t just receive raw outputs—you receive clear conclusions, high-quality visuals, and documentation that stands up to review. We combine SOP-driven execution with expert interpretation to support R&D decisions, QC investigations, and client submissions. SOP-Driven Testing All testing is performed using standardized workflows with traceable sample handling and documented instrument/test conditions. High-Resolution Images and Data Interpretation We provide high-resolution images and structured interpretation to highlight critical observations, anomalies, and trends—so your team can act quickly and confidently. Client-Specific, Regulatory-Style Reports We deliver clean, review-ready reports aligned to your format needs, including results tables, images/plots, method notes, and clear conclusions. Comparative and Failure Analysis Studies We support comparative studies across batches/conditions and root-cause investigations for defects, contamination, and performance issues—linking evidence to actionable insights.

68179d65be22ee500d53ff54 Card 2

product image
Material Characterization

At Dextrose Technologies Pvt. Ltd., we offer Particle Size Analysis using Dynamic Light Scattering (DLS) to measure nanoparticle size distribution, polydispersity index (PDI), and dispersion stability. DLS is a fast, reliable method for characterizing nanoformulations, colloids, emulsions, and particle dispersions, helping you confirm batch consistency and detect aggregation early. Nanoparticle size distribution We measure hydrodynamic particle size in the nanometer range and provide distribution outputs suited to your sample type and objective. Polydispersity and stability assessment We report PDI and support stability screening by comparing size/PDI across timepoints or conditions (pH, ionic strength, dilution, storage), enabling quick decisions on formulation robustness. Deliverables * Particle size distribution and key size metrics (as applicable) * PDI values with measurement conditions * Comparative summary across batches/conditions * Interpretation notes focused on stability and optimization actions Get started Share your sample type, medium (solvent/buffer), expected size range, and concentration. We’ll recommend the right DLS measurement plan and reporting format.

68179d65be22ee500d53ff54 Card 2

product image
Imaging & Characterization

At Dextrose Technologies Pvt. Ltd., we provide BET (Brunauer–Emmett–Teller) surface area analysis to quantify specific surface area and evaluate porosity-related properties of powders and porous materials. BET testing is widely used for catalysts, adsorbents, carbon materials, metal oxides, ceramics, and porous solids, helping you correlate surface area and pore structure with performance and batch consistency. Surface area determination We determine specific surface area (m²/g) using gas adsorption methods and provide comparative summaries across batches or processing conditions. Pore size and volume analysis We support pore characterization by reporting pore volume and pore size distribution (as per method scope), useful for adsorption performance, filtration behavior, and material selection. Catalyst, adsorbent, and material evaluation BET helps evaluate catalysts and adsorbents for surface activity, and supports material QC by tracking porosity changes due to synthesis, activation, milling, or heat treatment. Deliverables * BET surface area (m²/g) * Pore volume and pore size distribution (as applicable) * Isotherm plots/data summary and key parameters * Interpretation notes for batch comparison and performance relevance Get started Share your material type, expected surface area range, degassing conditions (if known), and objective (QC, R&D, catalyst/adsorbent evaluation). We’ll recommend the right BET scope and reporting format.

68179d65be22ee500d53ff54 Card 2

product image
Imaging & Characterization

At Dextrose Technologies Pvt. Ltd., we provide EDS/EDX (Energy Dispersive X-ray Analysis)—typically integrated with SEM—to deliver elemental composition and spatial mapping of materials. EDX helps identify what elements are present, where they are located, and how they are distributed, making it highly effective for contamination investigations, impurity localization, and surface/cross-sectional studies. Elemental composition and mapping We perform spot/area analysis and elemental mapping to understand composition and distribution trends across regions of interest. Contaminant and impurity localization EDX is ideal for identifying foreign particles, inclusions, deposits, corrosion products, and process contaminants by pinpointing elemental signatures at the defect site. Surface and cross-sectional analysis We support surface and cross-sectional evaluation (sample-prep dependent) to assess coatings, layers, diffusion regions, and interface contamination. Deliverables * Elemental spectra with identified peaks * Quant summary (wt%/at% as applicable) * Elemental maps and/or line scans (as required) * Clear observations and interpretation notes linked to images Get started Share your sample type, suspected contaminant (if any), and whether you need spot analysis, mapping, or cross-section review. We’ll recommend the best SEM-EDX workflow.

68179d65be22ee500d53ff54 Card 2

product image
Imaging & Characterization

At Dextrose Technologies Pvt. Ltd., we provide TEM (Transmission Electron Microscopy) to visualize internal structure at the nanoscale, enabling detailed analysis of nanoparticles, fine particulates, thin films, and advanced materials. TEM is ideal when SEM is not sufficient and you need high-resolution insight into particle dispersion, internal morphology, and lattice-level features (scope dependent on sample and preparation feasibility). Internal structure and nanoscale imaging TEM allows direct imaging of internal morphology, particle boundaries, and nanoscale features that drive material performance. We support comparative analysis across batches and processing conditions. Particle dispersion and lattice structure analysis We assess particle dispersion and aggregation trends, and support lattice-level analysis where applicable (e.g., lattice fringes / crystallographic features), helping you understand crystallinity and structural uniformity. Deliverables * TEM images at multiple magnifications * Dispersion/aggregation observations (image-based) * Lattice/structural notes where applicable * Report-ready documentation for R&D and characterization Get started Share your sample type (nanoparticles/thin film/powder), expected size range, and objective (dispersion, internal structure, lattice). We’ll recommend feasibility, sample prep approach, and deliverables.

68179d65be22ee500d53ff54 Card 2

product image
Thermal Analysis & Characterization

At Dextrose Technologies Pvt. Ltd., we provide Zeta Potential Analysis to measure surface charge and assess colloidal stability of dispersions, suspensions, emulsions, and nanoformulations. Zeta potential helps predict electrostatic repulsion/attraction between particles, supporting decisions on formulation robustness, aggregation risk, and stability under different conditions. Surface Charge Measurement We measure zeta potential to understand particle surface charge behavior in the selected medium (buffer/solvent), supporting formulation tuning and batch comparison. Colloidal Stability Assessment We evaluate stability risk by correlating zeta potential with aggregation tendencies and comparing results across formulations, pH, ionic strength, or storage conditions. Suspension and Emulsion Stability Studies We support stability screening of suspensions and emulsions by tracking zeta potential changes across timepoints or stress conditions, helping you select more stable compositions. Electrostatic Interaction Evaluation We assess electrostatic interaction trends between particles and additives (surfactants, polymers, salts) to guide formulation optimization and compatibility decisions. Deliverables * Zeta potential results (mV) with measurement conditions * Comparative summary across samples/conditions * Interpretation notes focused on stability and optimization actions * Optional pairing with DLS size/PDI for complete dispersion characterization Get started Share your sample type, medium (solvent/buffer), pH range, and objective (stability, compatibility, optimization). We’ll recommend the right measurement plan.

68179d65be22ee500d53ff54 Card 2

product image
Thermal Analysis & Characterization

At Dextrose Technologies Pvt. Ltd., we provide Thermogravimetric Analysis (TGA) and Derivative Thermogravimetric Analysis (DTG) for thermal and physicochemical characterization of materials. TGA measures weight change vs temperature/time, while DTG highlights rate of mass loss, helping you evaluate moisture/volatile content, thermal stability, decomposition stages, ash/residue, and composition trends in multi-component systems. Thermogravimetric Analysis (TGA) We generate TGA curves to quantify mass loss steps and residual mass under defined heating programs and atmospheres (as per scope). Derivative Thermogravimetric Analysis (DTG) DTG profiles help separate overlapping events and identify key decomposition temperatures by showing the mass-loss rate peaks. Moisture and Volatile Content Determination We quantify early-stage mass loss attributed to moisture and low-boiling volatiles, useful for raw material control and process optimization. Thermal Stability and Decomposition Profiling We assess onset temperatures and decomposition stages to compare batches, evaluate stability, and understand thermal behavior under heating. Ash Content and Residue Analysis We report final residue/ash percentage to support inorganic content assessment and compositional comparison. Composition Analysis of Multi-Component Systems We interpret multi-step mass-loss behavior to provide composition insights (e.g., binder/filler/organic fraction trends), with recommendations for confirmatory techniques if required. Deliverables * TGA and DTG curves with key temperatures (onset/peaks) * % mass loss by stage + final residue/ash % * Comparative summary across samples/batches * Interpretation notes aligned to your objective Get started Share your material type, expected temperature range, sample form, and objective (moisture, stability, ash, composition). We’ll recommend the right TGA/DTG program and reporting format.

68179d65be22ee500d53ff54 Card 2

product image
Thermal Analysis & Characterization

At Dextrose Technologies Pvt. Ltd., we provide Differential Scanning Calorimetry (DSC) for thermal and physicochemical characterization of solids and liquids. DSC measures heat flow associated with thermal transitions, enabling you to evaluate melting behavior, glass transition (Tg), crystallinity/polymorphism trends, and compatibility—useful for R&D, formulation work, and quality investigations. Differential Scanning Calorimetry – Solids & Liquids We analyze a wide range of materials to understand thermal transitions and compare batches, formulations, or processing conditions. Melting Point Determination We determine melting onset/peak behavior and compare thermal profiles to support identity checks, batch consistency, and impurity indications. Glass Transition Temperature (Tg) Analysis We identify Tg for amorphous or semi-amorphous materials and evaluate changes due to moisture, formulation, or processing. Crystallinity and Polymorphism Assessment We assess thermal signatures to support crystallinity trends and polymorphic differences (DSC-supported assessment; confirmatory tools may be recommended if needed). Drug–Excipient Compatibility Studies We compare DSC thermograms of APIs, excipients, and blends to flag potential interactions and compatibility risks during formulation development. Purity Assessment (Thermal Behavior) We use thermal behavior as a supportive indicator of purity and consistency (e.g., peak broadening/shift), aligned to project needs. Deliverables * DSC thermograms with key transition temperatures (onset/peak/Tg) * Comparative summary across samples/batches * Interpretation notes and recommendations for follow-up testing if required Get started Share your material type (solid/liquid), expected transition range, sample count, and objective (Tg, melting, compatibility, crystallinity). We’ll recommend the right DSC conditions and reporting format.

Still searching for
sem analysis?