Bangalore
08042753298
+919686928701

Items tagged with 'size'

68179d65be22ee500d53ff54 Card 2

product image
Material Characterization

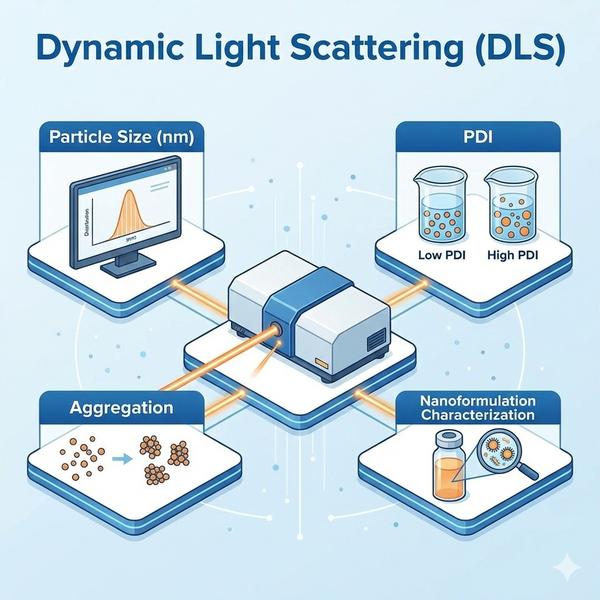
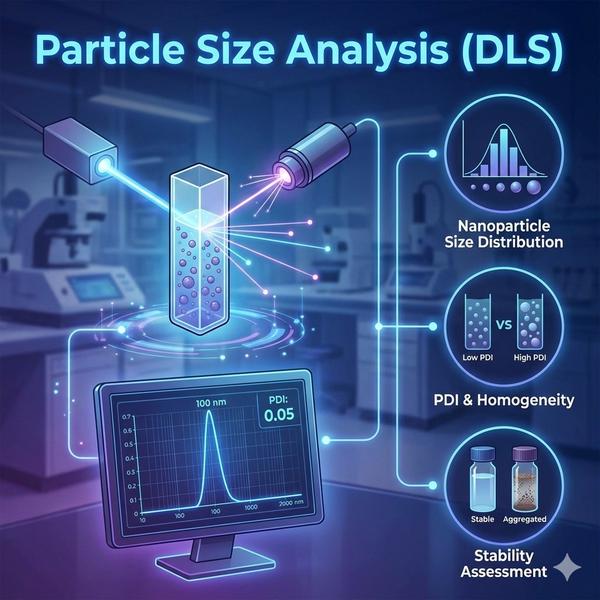
At Dextrose Technologies Pvt. Ltd., we offer Particle Size Analysis using Dynamic Light Scattering (DLS) to measure nanoparticle size distribution, polydispersity index (PDI), and dispersion stability. DLS is a fast, reliable method for characterizing nanoformulations, colloids, emulsions, and particle dispersions, helping you confirm batch consistency and detect aggregation early. Nanoparticle size distribution We measure hydrodynamic particle size in the nanometer range and provide distribution outputs suited to your sample type and objective. Polydispersity and stability assessment We report PDI and support stability screening by comparing size/PDI across timepoints or conditions (pH, ionic strength, dilution, storage), enabling quick decisions on formulation robustness. Deliverables * Particle size distribution and key size metrics (as applicable) * PDI values with measurement conditions * Comparative summary across batches/conditions * Interpretation notes focused on stability and optimization actions Get started Share your sample type, medium (solvent/buffer), expected size range, and concentration. We’ll recommend the right DLS measurement plan and reporting format.

68179d65be22ee500d53ff54 Card 2

product image
Molecular Services

At Dextrose Technologies Pvt. Ltd., we provide PCR and gene-level services to support rapid detection, target confirmation, and research workflows. From target-specific primer design to PCR execution and reporting, we deliver clear, reproducible outputs for academic, industrial, and R&D applications. Primer Design (Target-Specific) We design primers based on your target gene/region and intended application (detection, confirmation, or expression studies). Designs are optimized for specificity, amplicon size, and assay conditions. Primer Synthesis (Research Grade) We support research-grade primer synthesis and coordinate delivery based on your required scale and format. PCR Services Conventional PCR: Target amplification for detection, confirmation, and downstream sequencing. Gradient PCR: Optimization of annealing temperature to improve specificity and yield, especially for new primer sets or challenging templates. RT-PCR (Gene Expression / Detection Studies) We support RT-PCR workflows for gene expression and detection studies (scope dependent on sample type and experimental design), with structured reporting aligned to your objective. Deliverables * Primer details and assay conditions (as applicable) * PCR/RT-PCR results summary with interpretation notes * Gel images (for conventional PCR) and run documentation * Recommendations for sequencing confirmation when required Get started Share your target gene/organism, sample type (DNA/cDNA), expected amplicon size, and objective (detection/confirmation/expression). We’ll recommend the most suitable workflow.

68179d65be22ee500d53ff54 Card 2

product image
Molecular Services

At Dextrose Technologies Pvt. Ltd., we provide advanced genomics services to support deeper genetic characterization, variant analysis, and sequencing-based insights for research and applied projects. From microbial whole genome sequencing to targeted DNA sequencing, we deliver structured outputs with interpretation-focused reporting. Whole Genome Sequencing (WGS) – Microbial genome characterization We support microbial WGS to enable genome-level characterization, strain comparison, and genetic feature discovery (project scope dependent), with deliverables designed for research workflows. Whole Exome Sequencing (WES) – Coding-region variant analysis We support WES for coding-region variant analysis with defined study goals and reporting scope (research use; clinical interpretation requires appropriate clinical oversight). DNA Sequencing (Sanger / NGS-based applications) We support Sanger sequencing for targeted confirmation and NGS-based applications for broader sequencing needs. Approach is selected based on target region size, sample count, and required resolution. Deliverables * Raw data files (as applicable) + processed outputs * QC summary (read quality/coverage metrics as applicable) * Variant/annotation outputs (as per scope) * Clear interpretation notes and limitations aligned to intended use Get started Share organism/sample type, number of samples, study objective (strain typing/variant analysis/target confirmation), and whether you need Sanger, targeted NGS, WGS, or WES. We’ll recommend the right workflow and reporting format.

68179d65be22ee500d53ff54 Card 2

product image
Imaging & Characterization

At Dextrose Technologies Pvt. Ltd., we provide BET (Brunauer–Emmett–Teller) surface area analysis to quantify specific surface area and evaluate porosity-related properties of powders and porous materials. BET testing is widely used for catalysts, adsorbents, carbon materials, metal oxides, ceramics, and porous solids, helping you correlate surface area and pore structure with performance and batch consistency. Surface area determination We determine specific surface area (m²/g) using gas adsorption methods and provide comparative summaries across batches or processing conditions. Pore size and volume analysis We support pore characterization by reporting pore volume and pore size distribution (as per method scope), useful for adsorption performance, filtration behavior, and material selection. Catalyst, adsorbent, and material evaluation BET helps evaluate catalysts and adsorbents for surface activity, and supports material QC by tracking porosity changes due to synthesis, activation, milling, or heat treatment. Deliverables * BET surface area (m²/g) * Pore volume and pore size distribution (as applicable) * Isotherm plots/data summary and key parameters * Interpretation notes for batch comparison and performance relevance Get started Share your material type, expected surface area range, degassing conditions (if known), and objective (QC, R&D, catalyst/adsorbent evaluation). We’ll recommend the right BET scope and reporting format.

68179d65be22ee500d53ff54 Card 2

product image
Imaging & Characterization

At Dextrose Technologies Pvt. Ltd., we provide TEM (Transmission Electron Microscopy) to visualize internal structure at the nanoscale, enabling detailed analysis of nanoparticles, fine particulates, thin films, and advanced materials. TEM is ideal when SEM is not sufficient and you need high-resolution insight into particle dispersion, internal morphology, and lattice-level features (scope dependent on sample and preparation feasibility). Internal structure and nanoscale imaging TEM allows direct imaging of internal morphology, particle boundaries, and nanoscale features that drive material performance. We support comparative analysis across batches and processing conditions. Particle dispersion and lattice structure analysis We assess particle dispersion and aggregation trends, and support lattice-level analysis where applicable (e.g., lattice fringes / crystallographic features), helping you understand crystallinity and structural uniformity. Deliverables * TEM images at multiple magnifications * Dispersion/aggregation observations (image-based) * Lattice/structural notes where applicable * Report-ready documentation for R&D and characterization Get started Share your sample type (nanoparticles/thin film/powder), expected size range, and objective (dispersion, internal structure, lattice). We’ll recommend feasibility, sample prep approach, and deliverables.

68179d65be22ee500d53ff54 Card 2

product image
Imaging & Characterization

At Dextrose Technologies Pvt. Ltd., we provide SEM (Scanning Electron Microscopy) for high-resolution imaging and detailed surface characterization of materials and biological samples (as applicable). SEM helps you visualize surface morphology, topography, particles, and defects with clarity—supporting R&D, quality investigations, and failure analysis. Surface morphology and topographical analysis We capture high-magnification images to evaluate surface texture, porosity, cracks, coatings, and microstructural features. SEM is ideal for comparing batches, processing conditions, and material finishes. Particle shape and size evaluation We image particles to assess shape, agglomeration, and size distribution trends (image-based), supporting powders, pigments, fillers, nanomaterials (where applicable), and formulation studies. Failure and defect analysis We support root-cause investigations for defects such as fractures, delamination, inclusions, corrosion features, and surface contamination—providing image evidence and interpretation notes to guide corrective actions. Deliverables * High-resolution SEM images (multiple magnifications) * Observation summary highlighting key morphological features * Optional: EDX elemental mapping/spot analysis (if required) * Report-ready documentation for R&D or QC investigations Get started Share your sample type, objective (morphology/particles/failure), and preferred magnification range. We’ll recommend the best SEM imaging plan and deliverables.

68179d65be22ee500d53ff54 Card 2

product image
Thermal Analysis & Characterization

At Dextrose Technologies Pvt. Ltd., we provide Zeta Potential Analysis to measure surface charge and assess colloidal stability of dispersions, suspensions, emulsions, and nanoformulations. Zeta potential helps predict electrostatic repulsion/attraction between particles, supporting decisions on formulation robustness, aggregation risk, and stability under different conditions. Surface Charge Measurement We measure zeta potential to understand particle surface charge behavior in the selected medium (buffer/solvent), supporting formulation tuning and batch comparison. Colloidal Stability Assessment We evaluate stability risk by correlating zeta potential with aggregation tendencies and comparing results across formulations, pH, ionic strength, or storage conditions. Suspension and Emulsion Stability Studies We support stability screening of suspensions and emulsions by tracking zeta potential changes across timepoints or stress conditions, helping you select more stable compositions. Electrostatic Interaction Evaluation We assess electrostatic interaction trends between particles and additives (surfactants, polymers, salts) to guide formulation optimization and compatibility decisions. Deliverables * Zeta potential results (mV) with measurement conditions * Comparative summary across samples/conditions * Interpretation notes focused on stability and optimization actions * Optional pairing with DLS size/PDI for complete dispersion characterization Get started Share your sample type, medium (solvent/buffer), pH range, and objective (stability, compatibility, optimization). We’ll recommend the right measurement plan.

68179d65be22ee500d53ff54 Card 2

product image
Thermal Analysis & Characterization

At Dextrose Technologies Pvt. Ltd., we provide Dynamic Light Scattering (DLS) for rapid characterization of nanometer-range particle size distribution, polydispersity index (PDI), and dispersion stability. DLS is ideal for routine screening and development work in nanomaterials, nanoformulations, colloids, emulsions, and polymer/biomolecule dispersions, helping you confirm size consistency and detect aggregation early. Particle Size Distribution (Nanometer Range) We measure hydrodynamic particle size in the nm range and provide distribution outputs aligned to your sample type and objective. Polydispersity Index (PDI) Determination We report PDI to indicate dispersion uniformity and batch-to-batch consistency—useful for formulation control and stability screening. Aggregation and Stability Studies We evaluate aggregation trends by comparing size/PDI across conditions or timepoints (e.g., pH, ionic strength, dilution, storage), supporting stability decisions. Nanoformulation Characterization We support nanoformulation development by providing size and PDI benchmarks for optimization and comparative studies. Deliverables * Particle size distribution (Z-average and distribution outputs as applicable) * PDI values with measurement notes * Comparative summary across batches/conditions * Interpretation notes and recommendations for improving stability (scope-dependent) Get started Share your sample type (nanoparticles/emulsion/dispersion), solvent/buffer, expected size range, and concentration. We’ll recommend the right measurement plan and reporting format.

Still searching for
size?